Friends of mine, expecting at the time like my wife and I, alerted me to the fact that Ontario has a publicly available dataset of first names registered in the province since 1917. Because they are legit scientists, my friends used these data to identify a pool of potential names for their little one that met a bunch of specific criteria. I fiddled around with the dataset looking for inspiration but we had a pretty good idea already, so the data weren’t all that personally useful. It is interesting to look at more general trends, though.
I started by taking a look at significant names in my family. In order to appear in the dataset, names have to have a minimum of five registrations in a given year, so there are some names I can’t plot (looking at you, Colum and Joachim). Let’s start with the ladies:
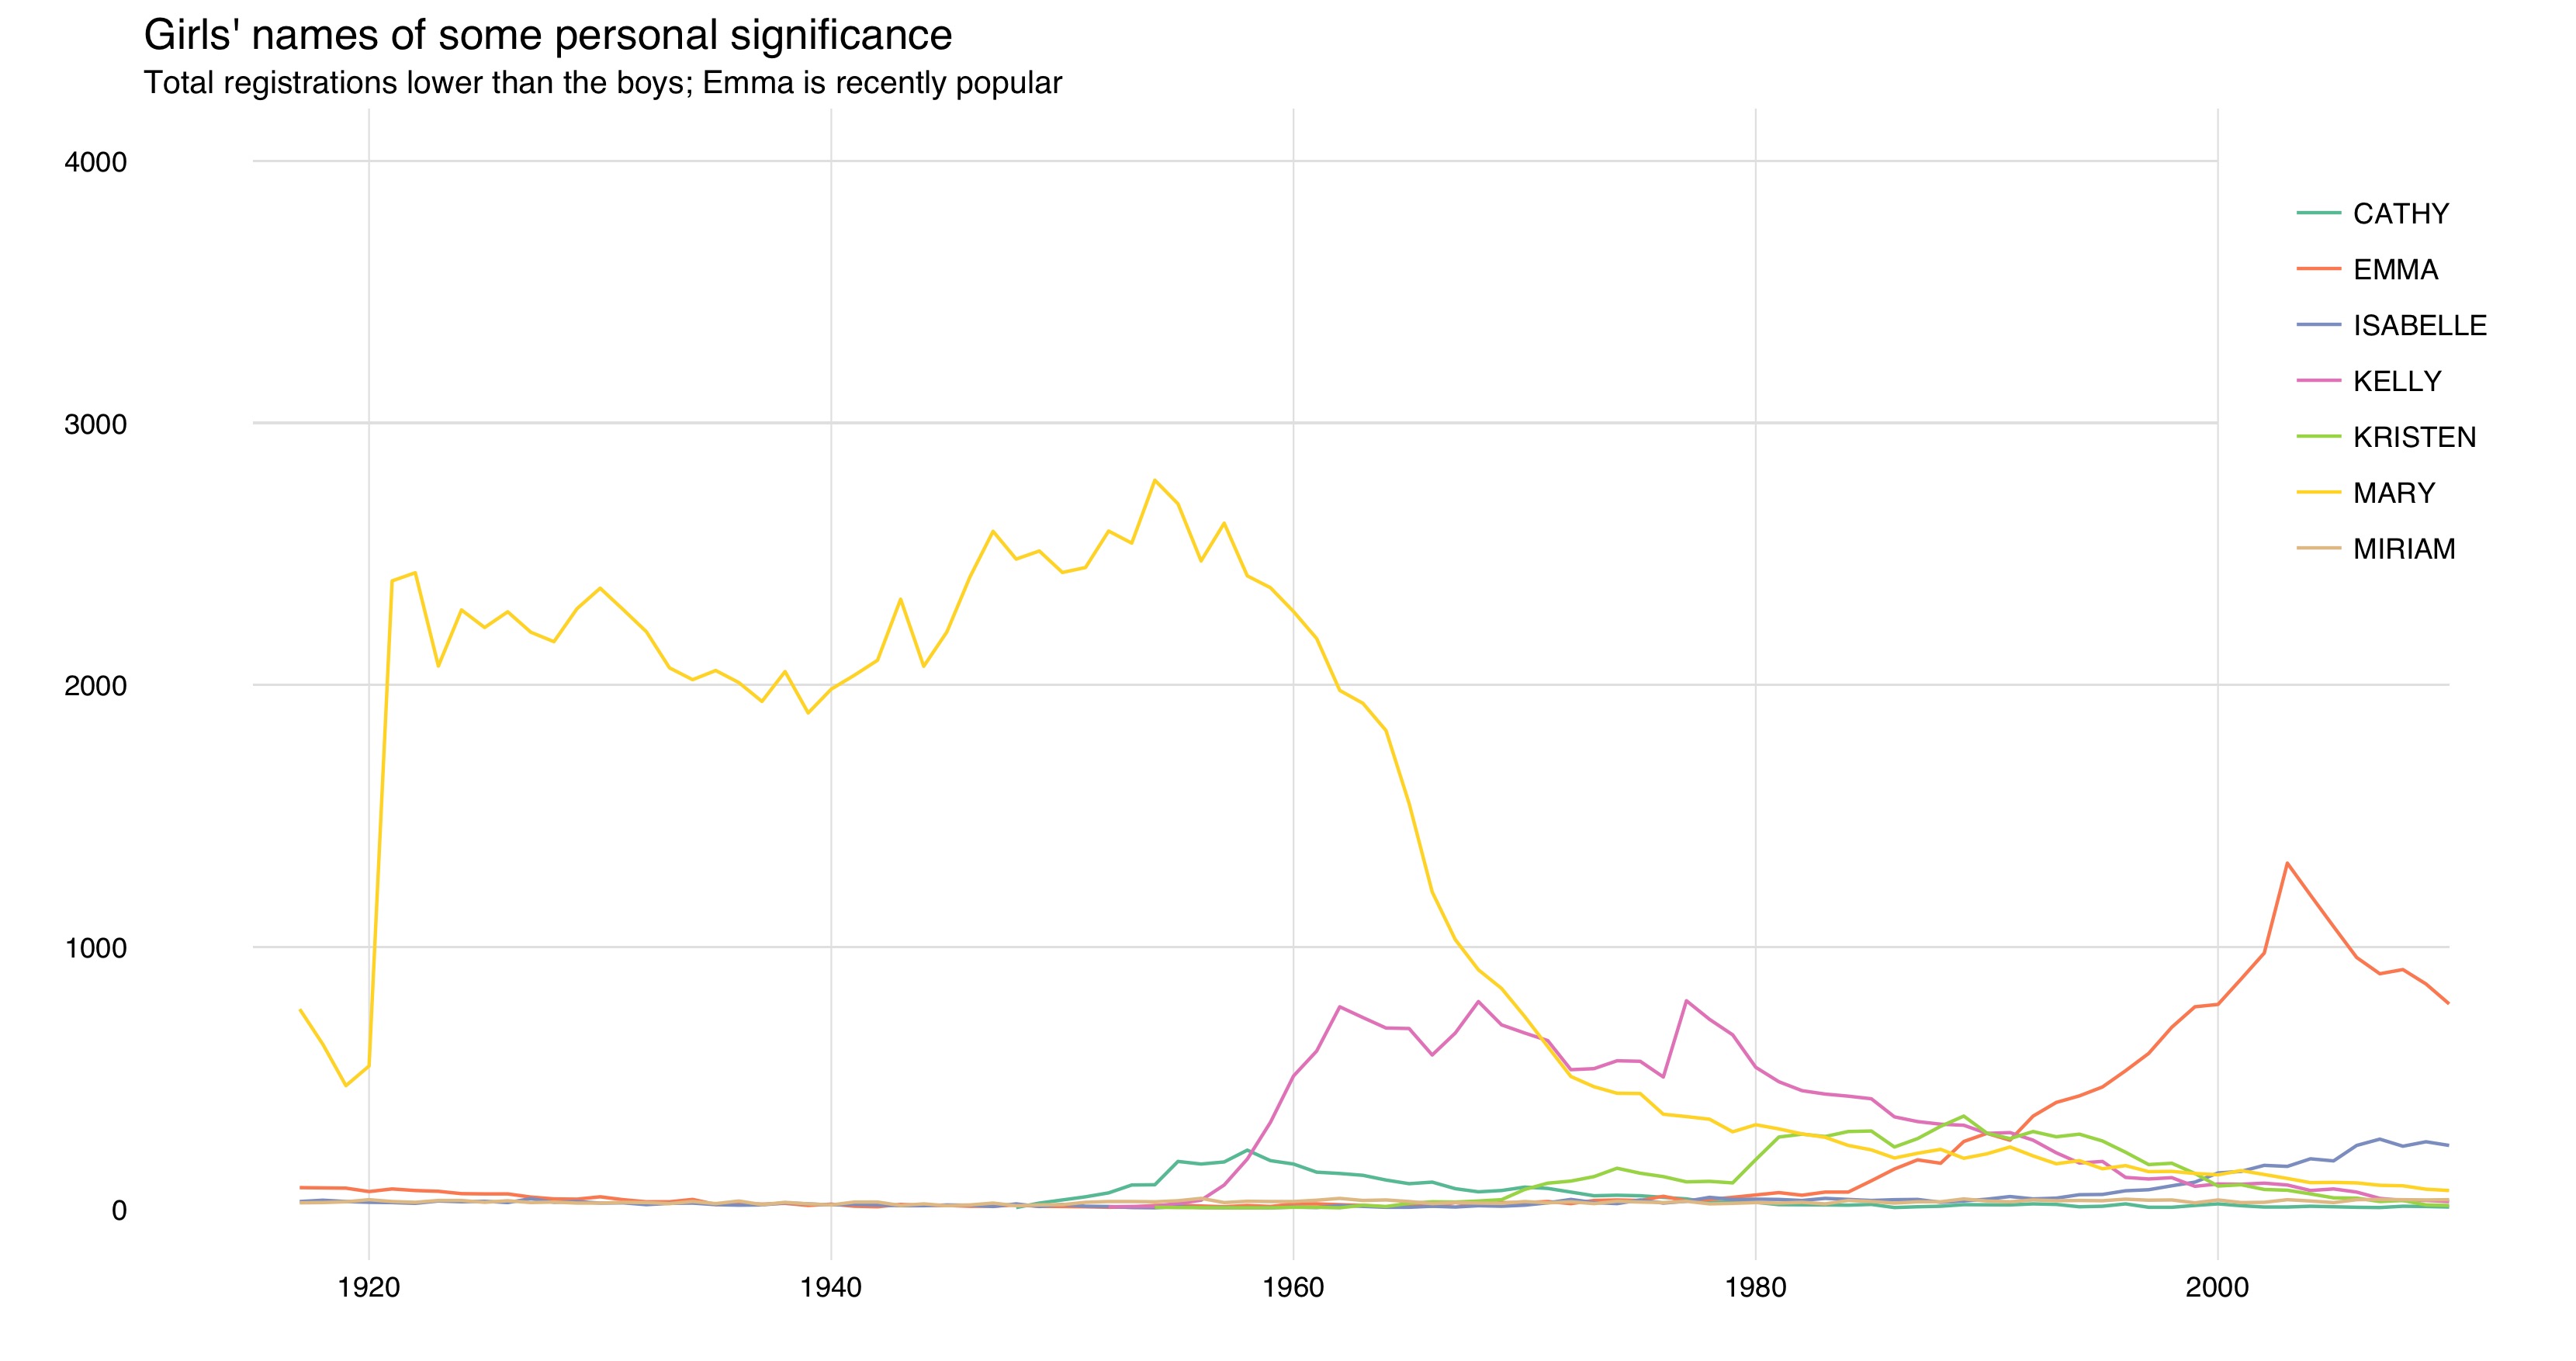
Each line represents a different name of some significance. Mary dominated the field until about 1960, when it saw a sharp drop in popularity. Kelly picked up around the same time and stayed fairly popular until 1990, but is now far less popular than I would have guessed. Emma and Isabelle have both seen significant gains in recent years, though Emma’s peak was reached in the early aughts. I was surprised by how unpopular Cathy was — until I realized I probably wasn’t capturing spelling variation:
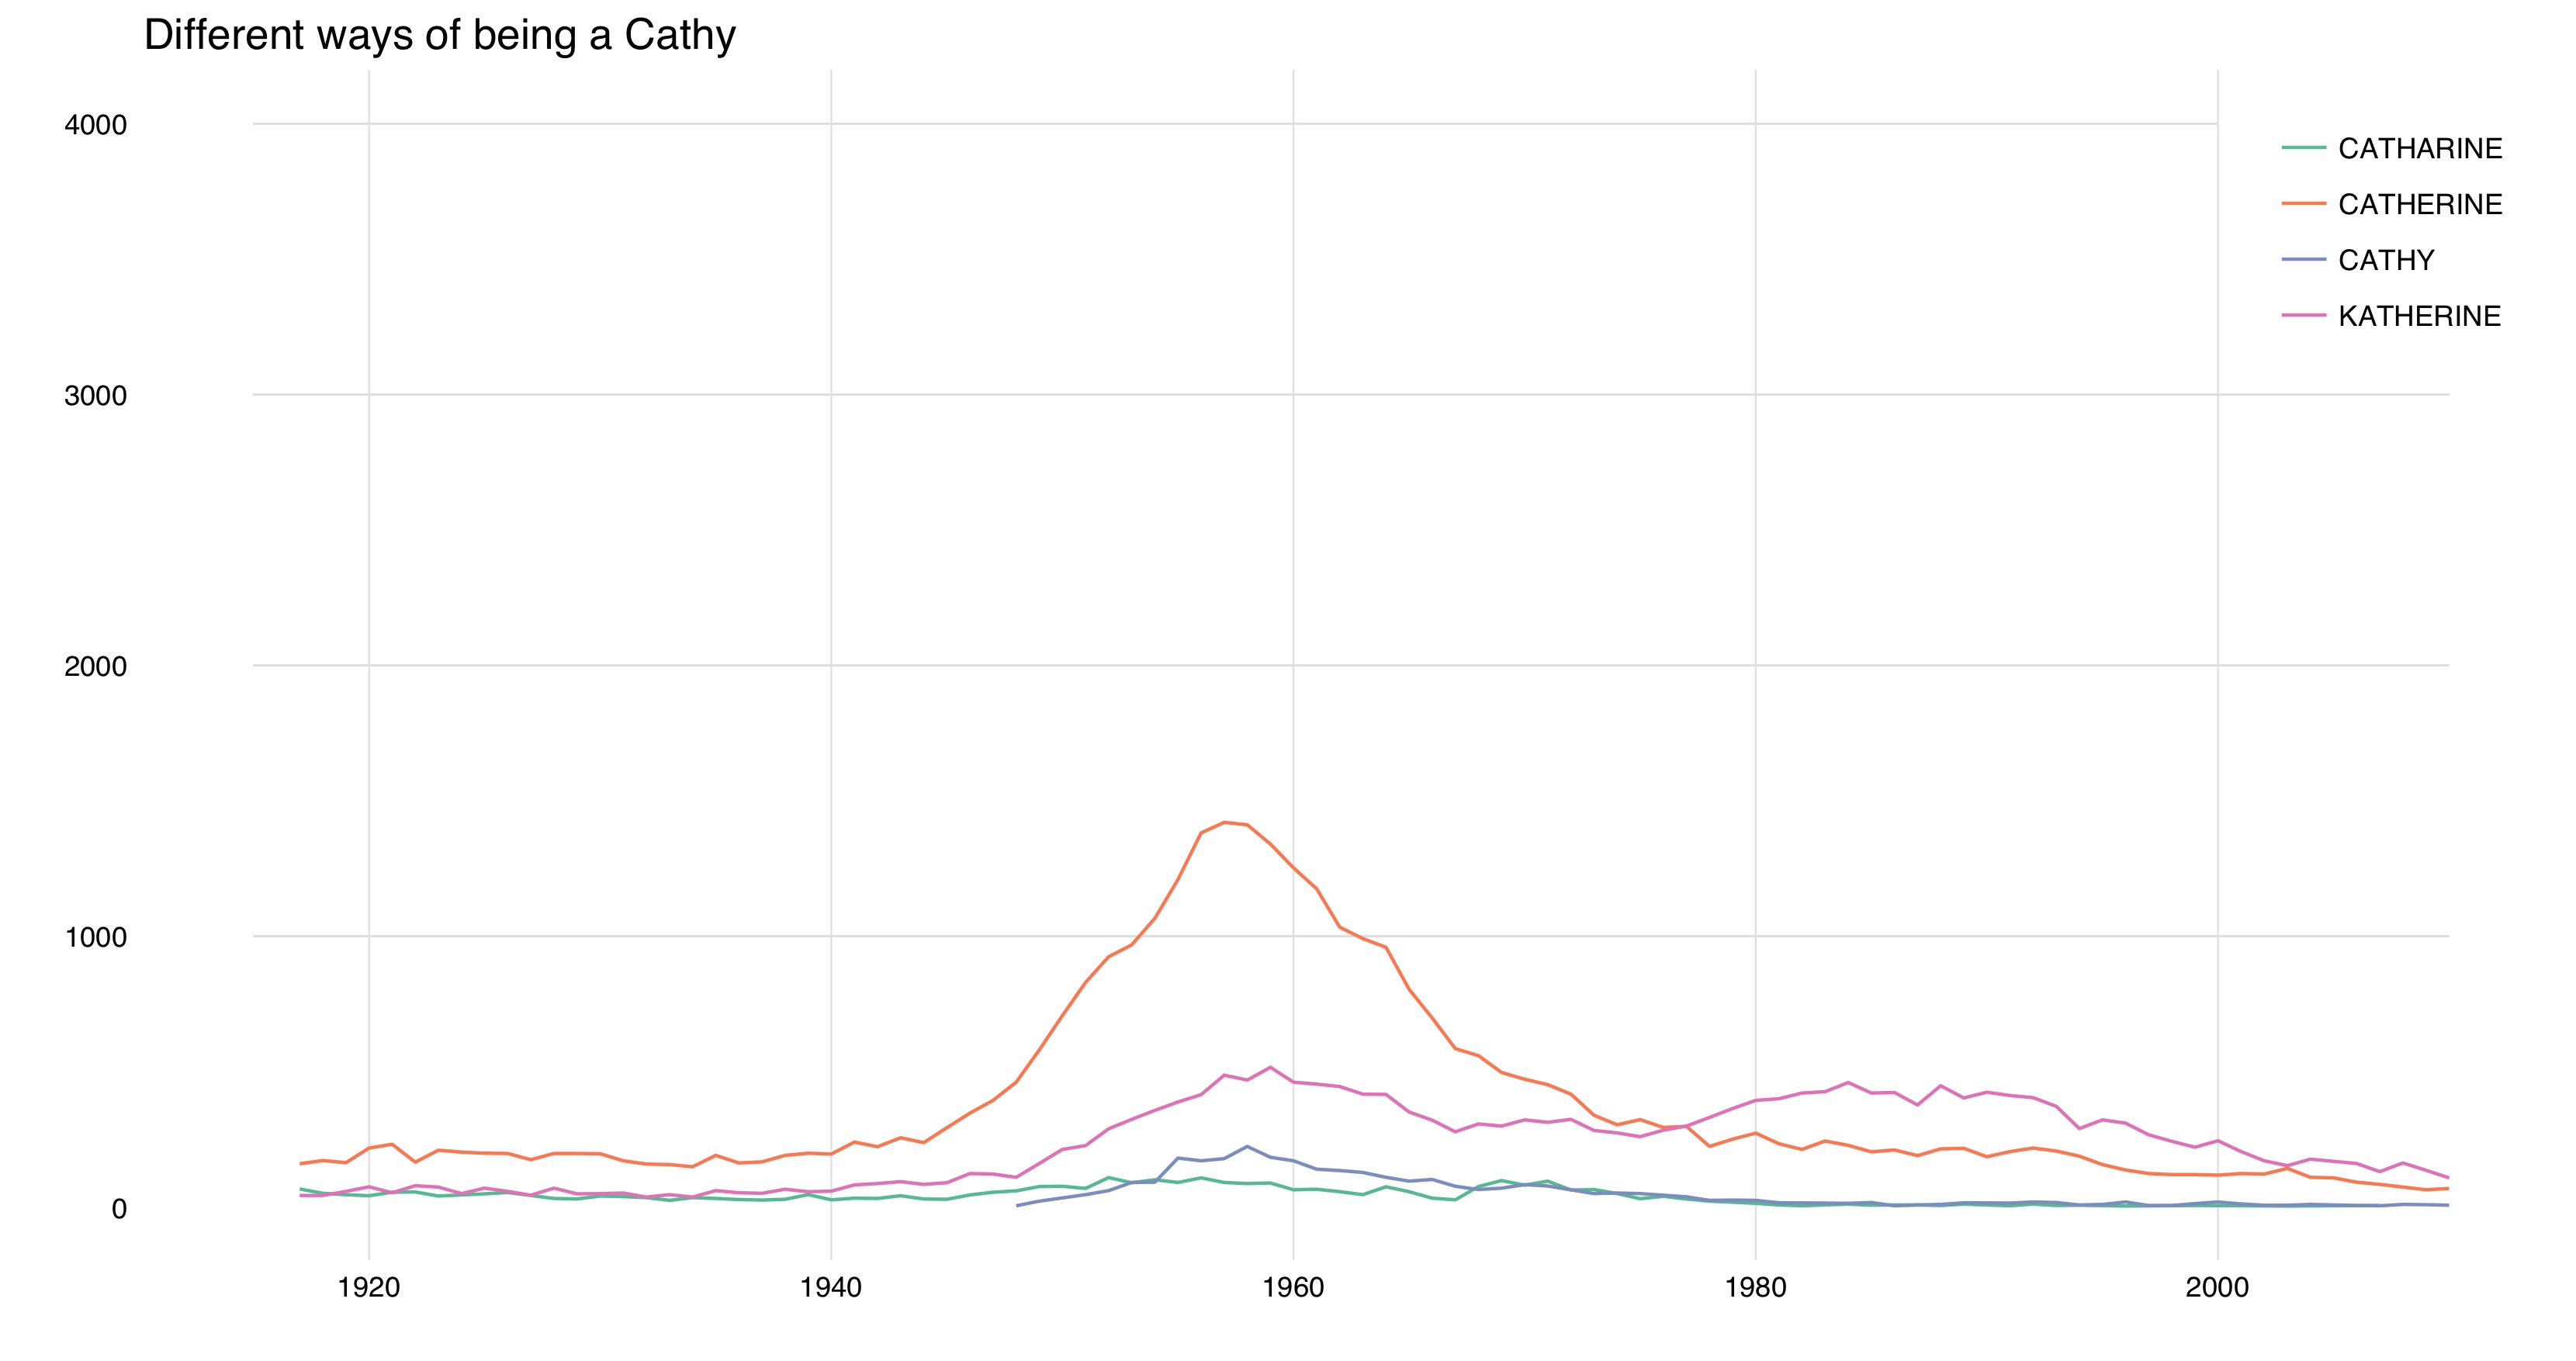
Cathy as a unique spelling only shows up in the late 40s, and the most popular variation was Catherine until the late 70s when the K came to prominence.
What about boys’ names?
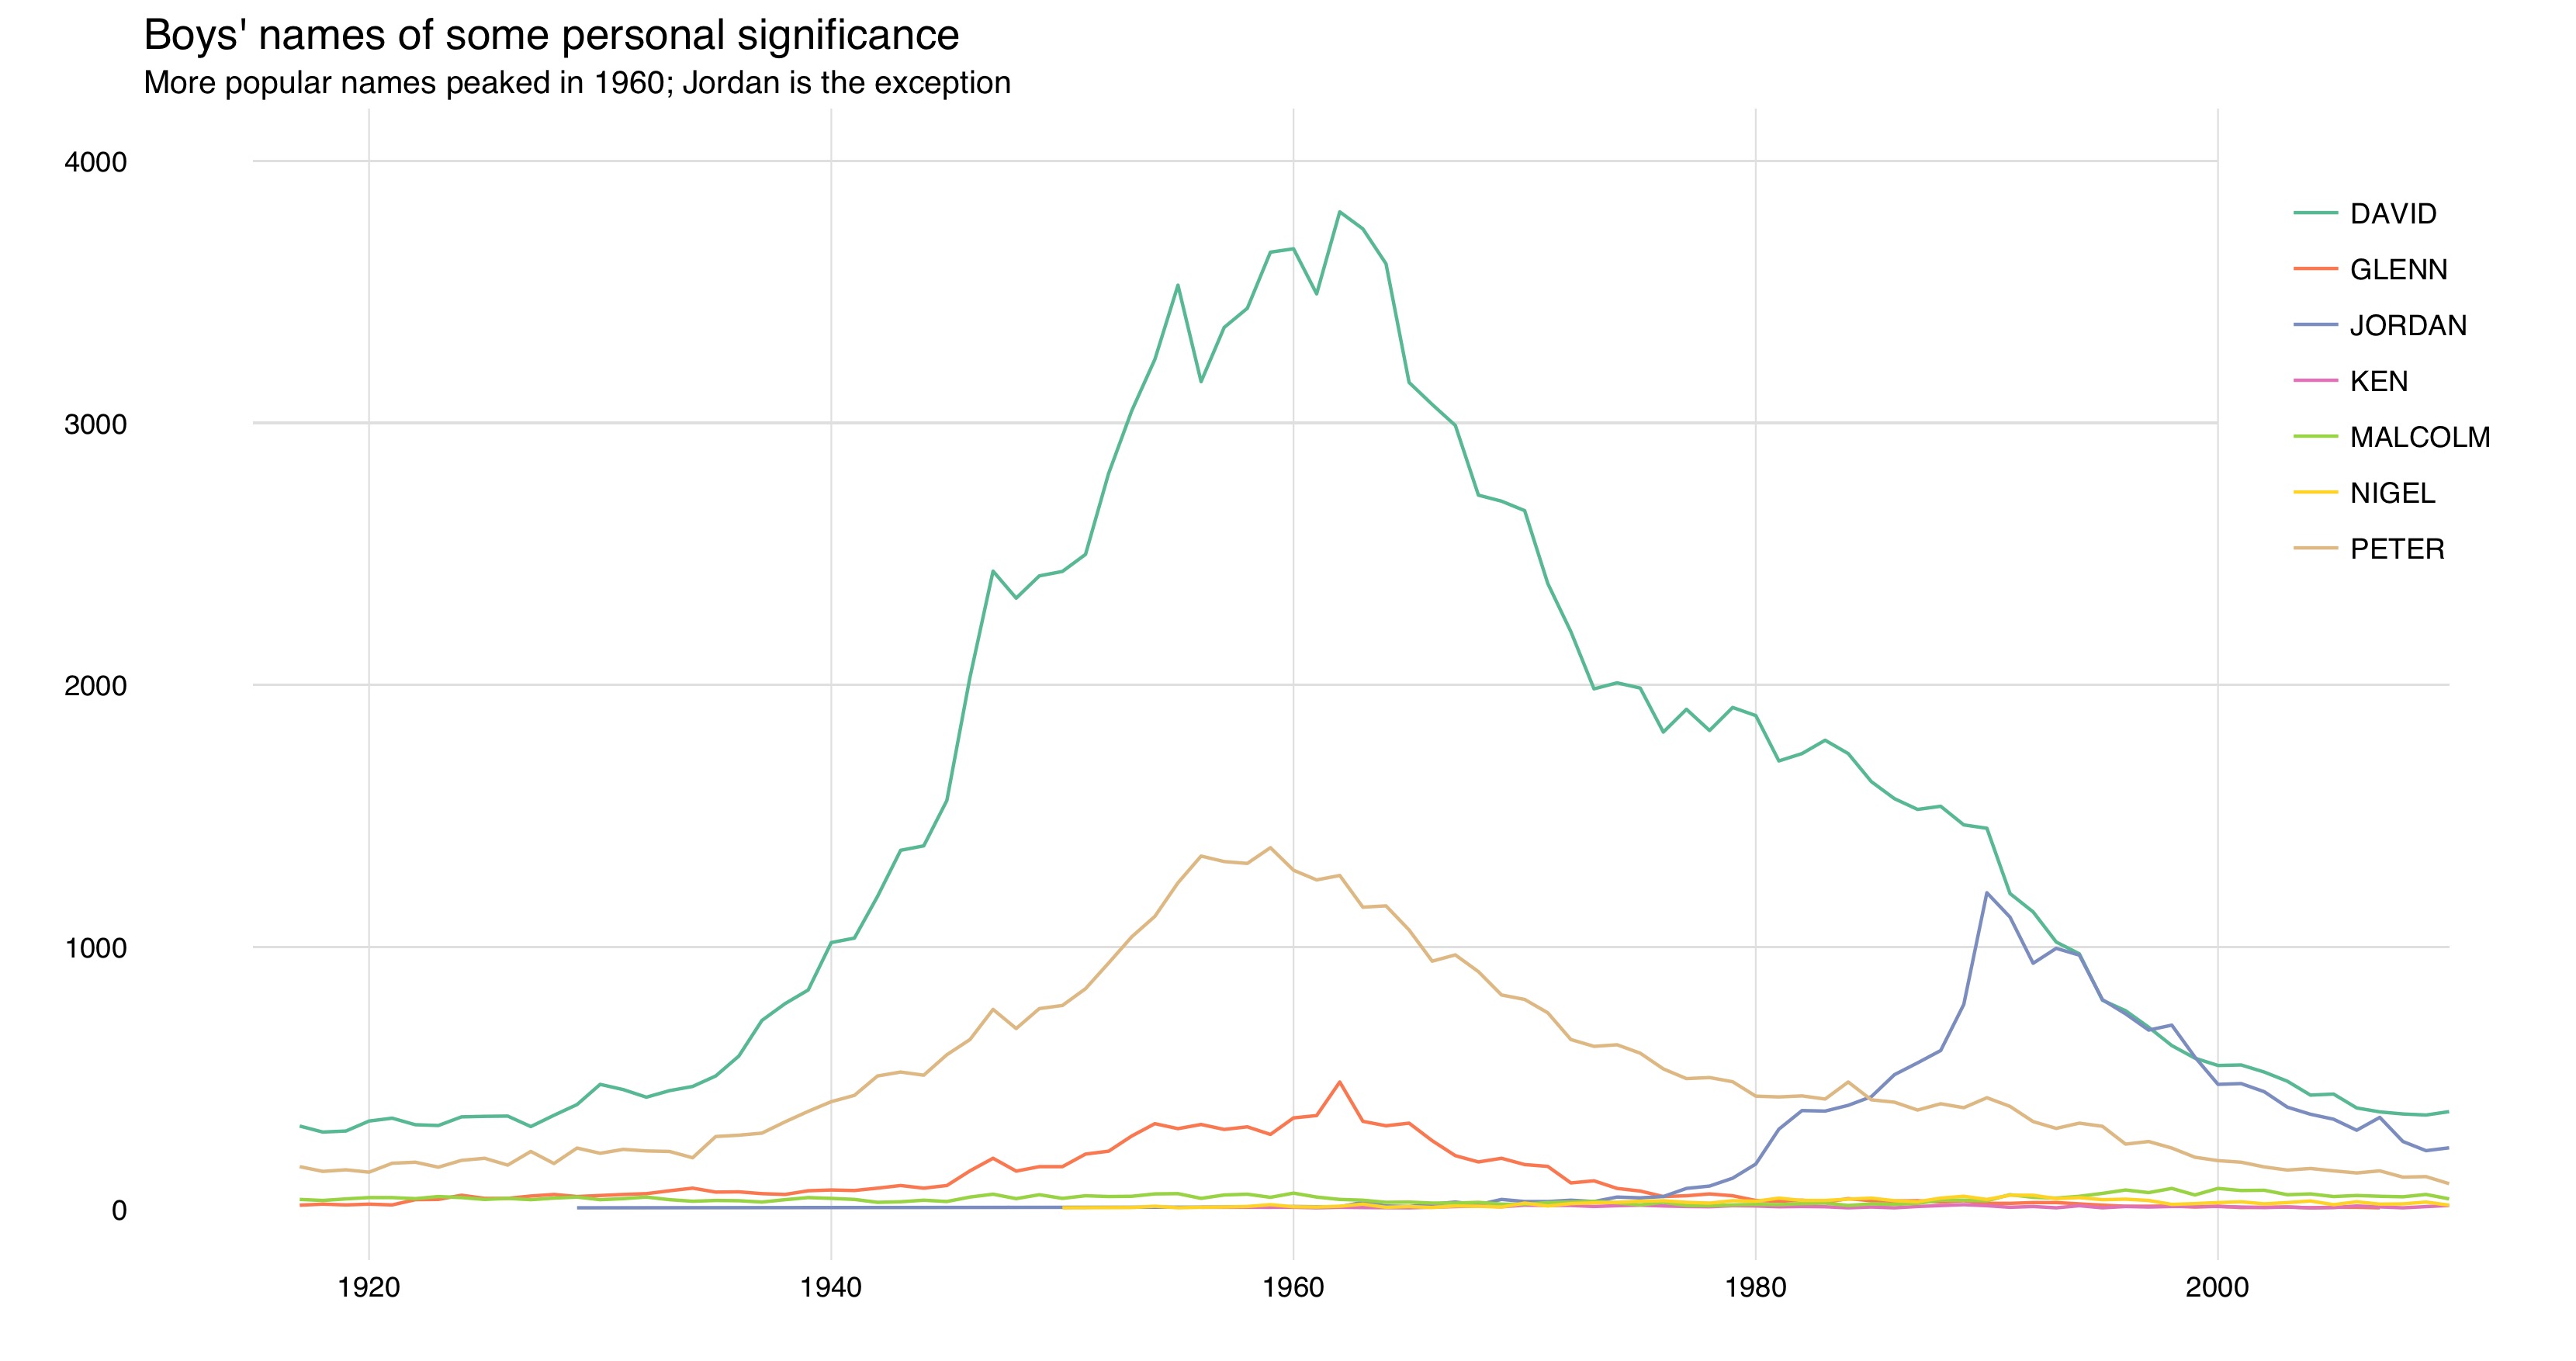
Historically, my name is quite popular: there were 3,805 Davids registered in Ontario in 1962. Peter was also common around the same time, and more recently Jordan shows strong numbers. Let’s give some of these names some interactivity:
It’s interesting that after peaks in popularity around 1960, all of the boys and girls names we’ve seen show fewer total registrations as we approach the present. The general increase until 1960 is likely driven in part by the birth rate:
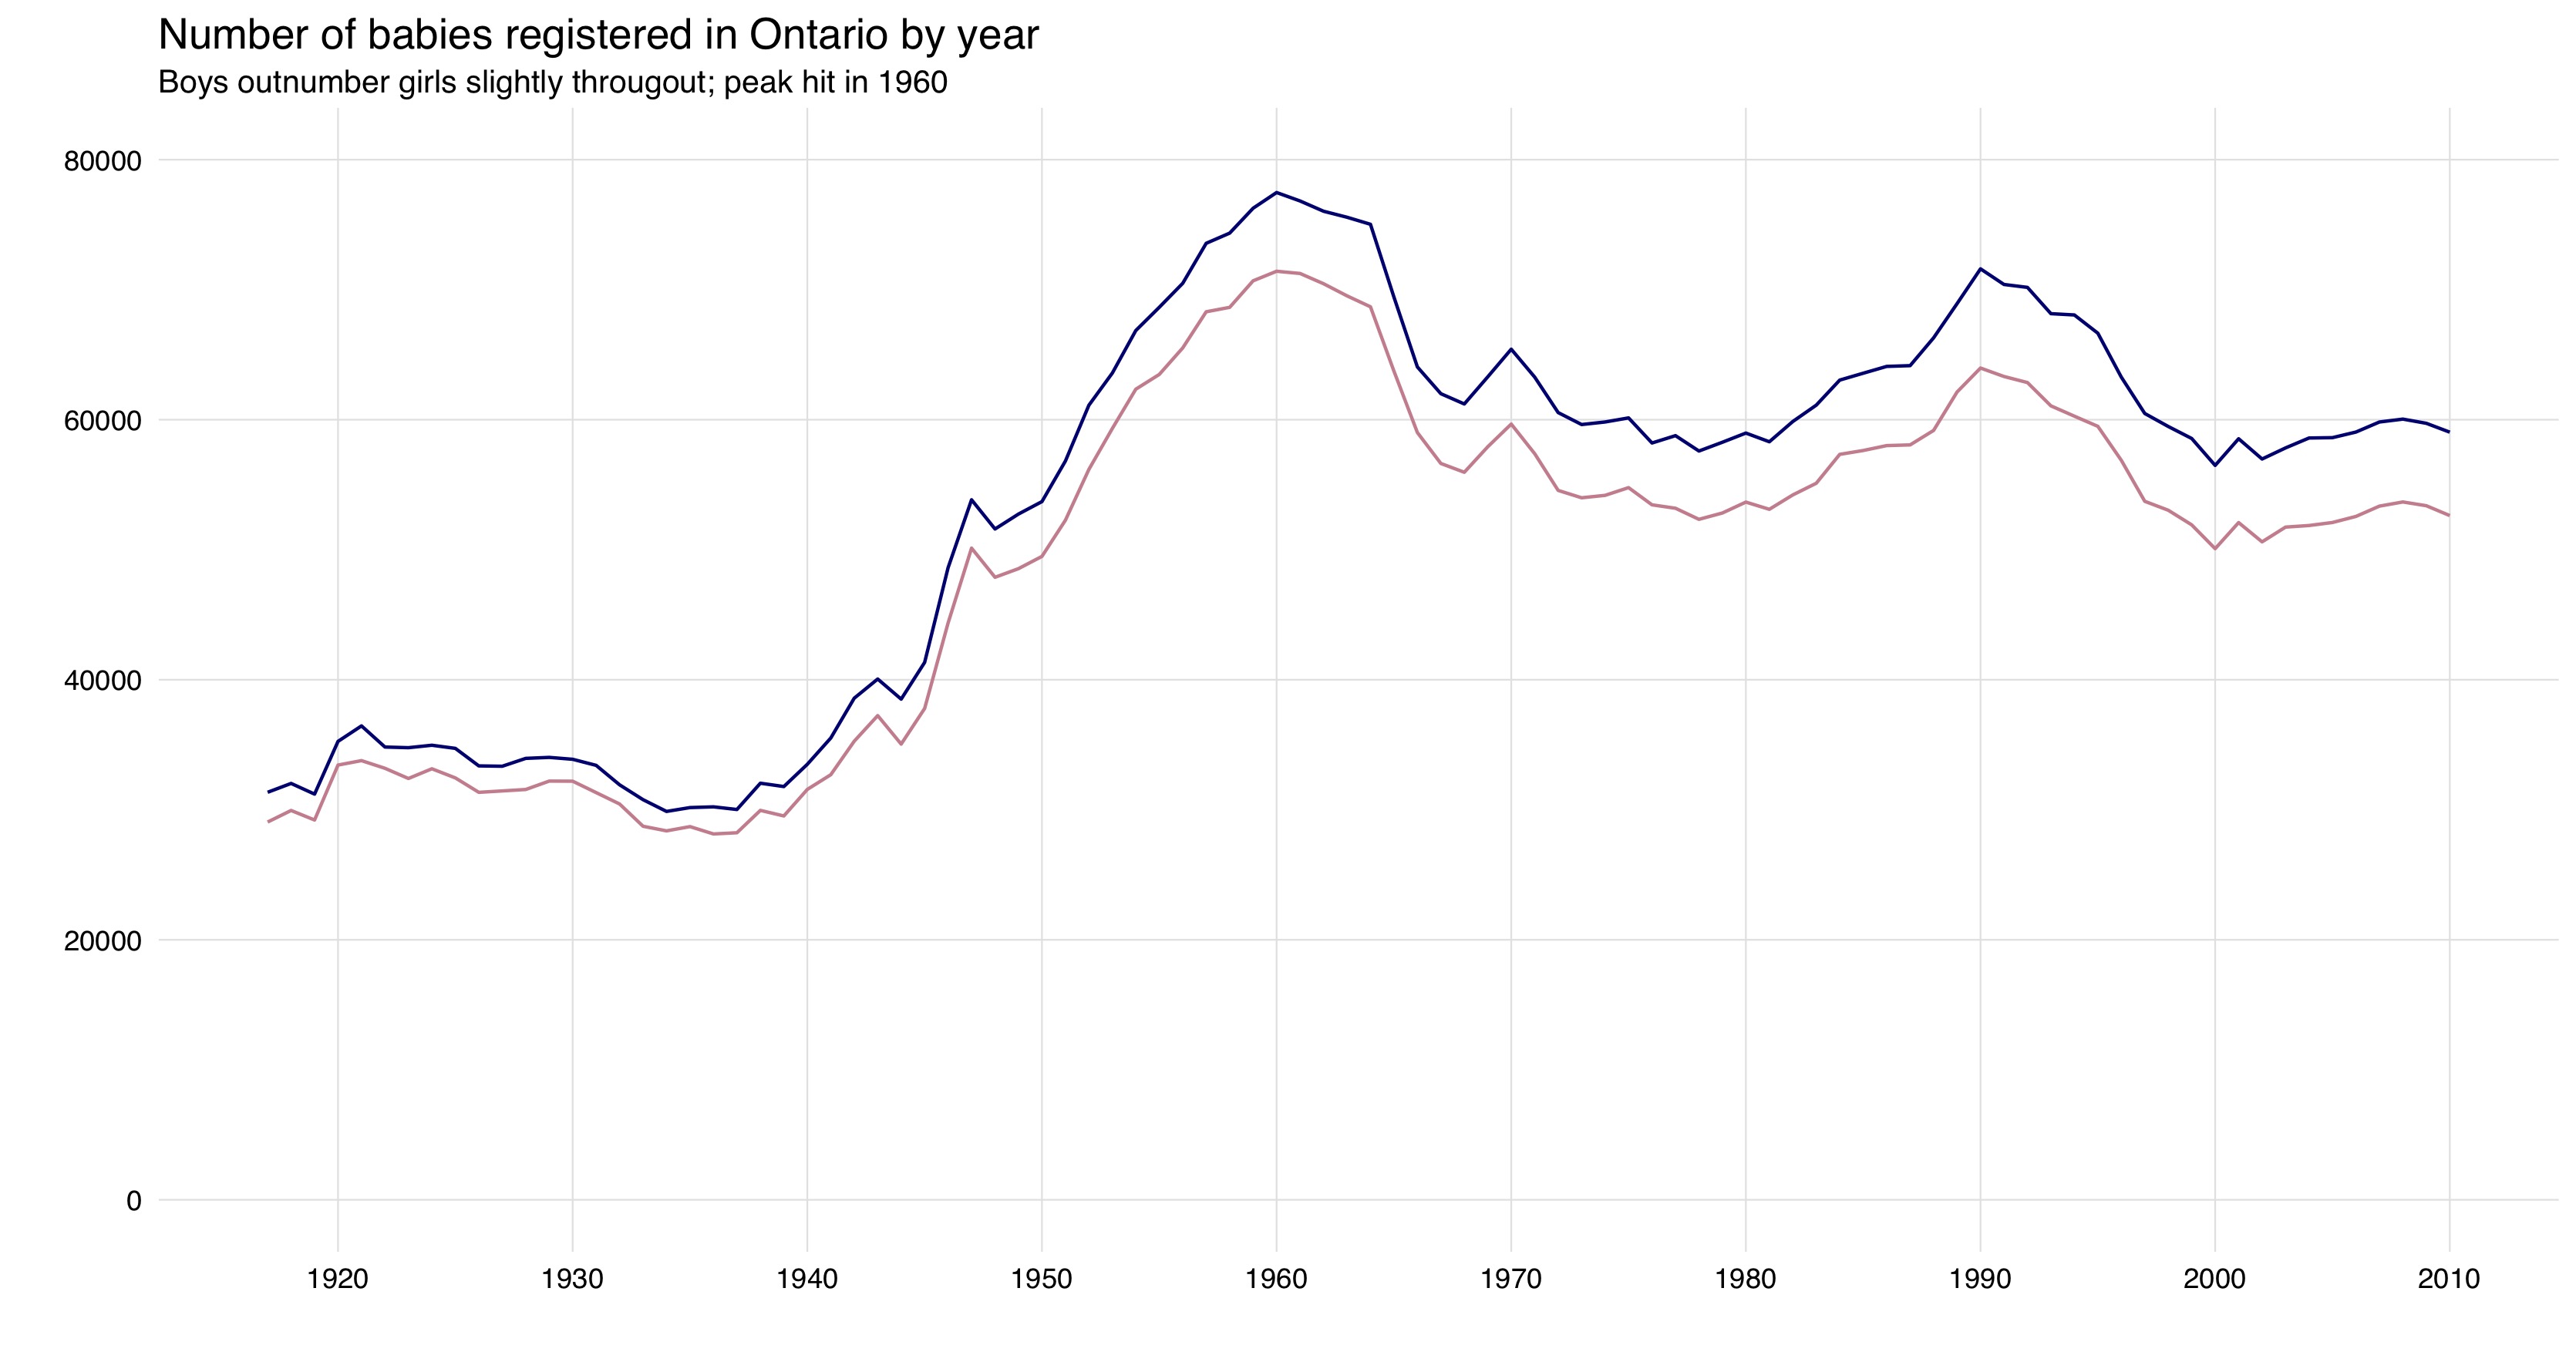
Total births per year for both boys and girls peaked in 1960. But the collapse in individual names is steeper than the birth rate decline. My hunch is that parents are selecting a broader range of names — confirmed by the following plot, which shows the total number of unique names registered in a given year:
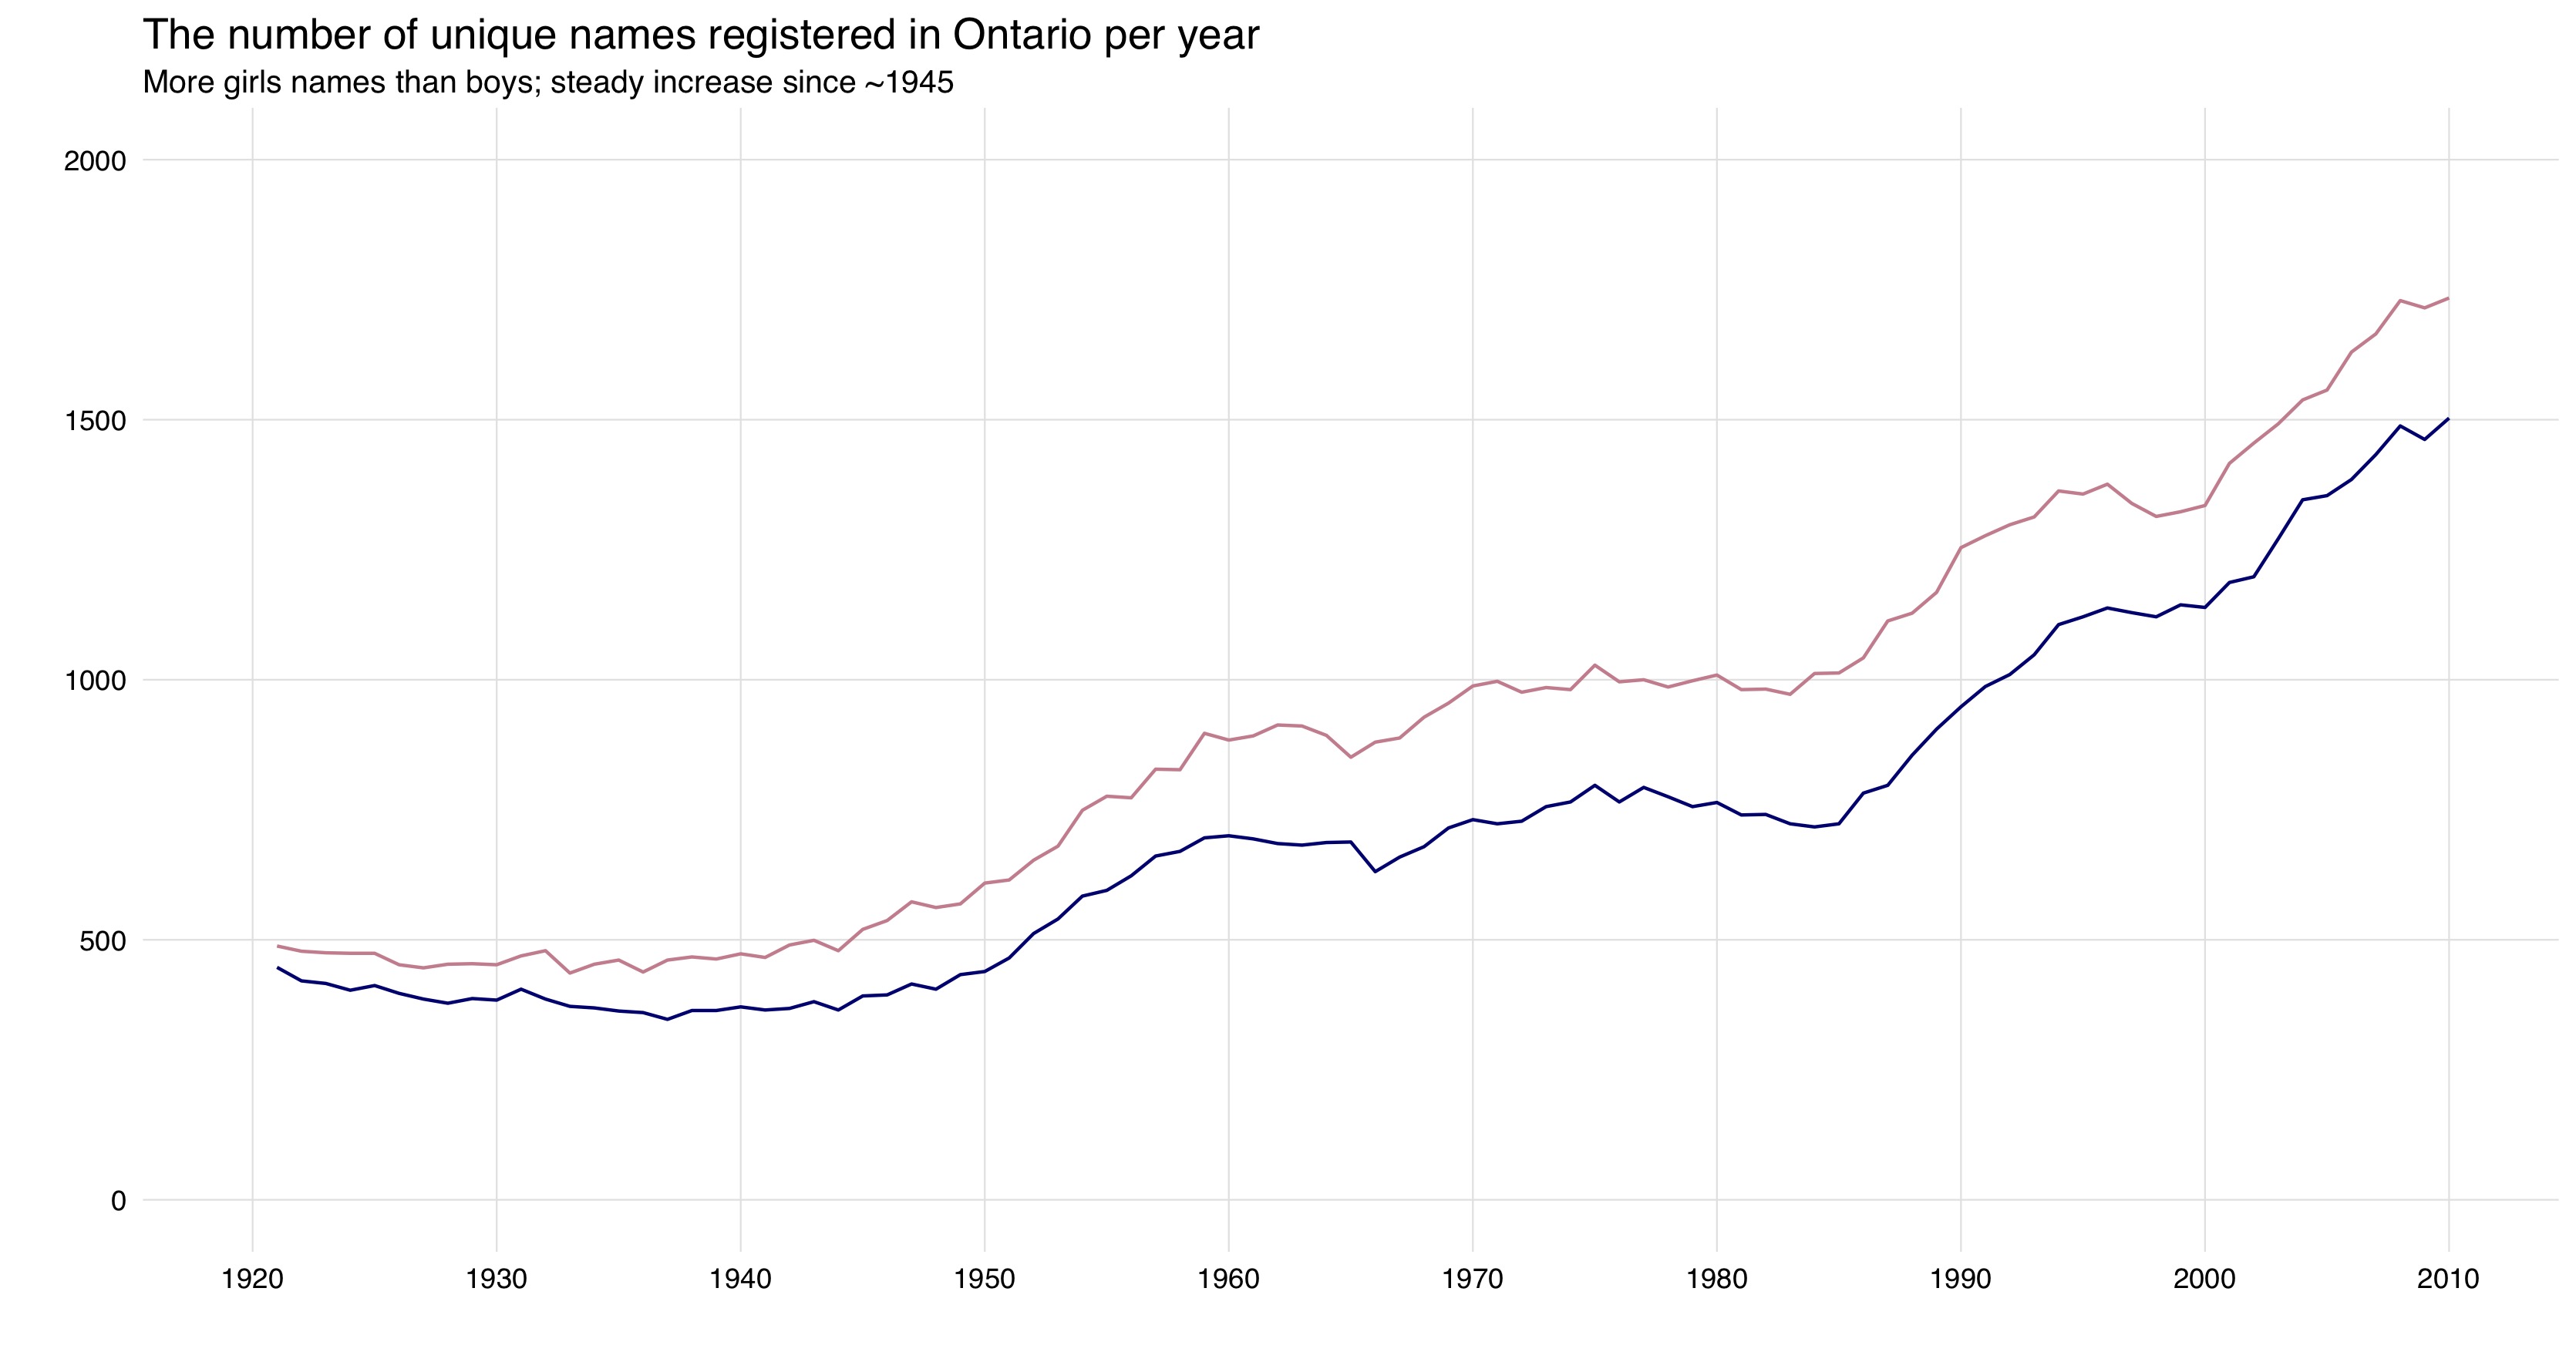
Parents are choosing a broader range of names since at least 1950, accelerating after 1985.
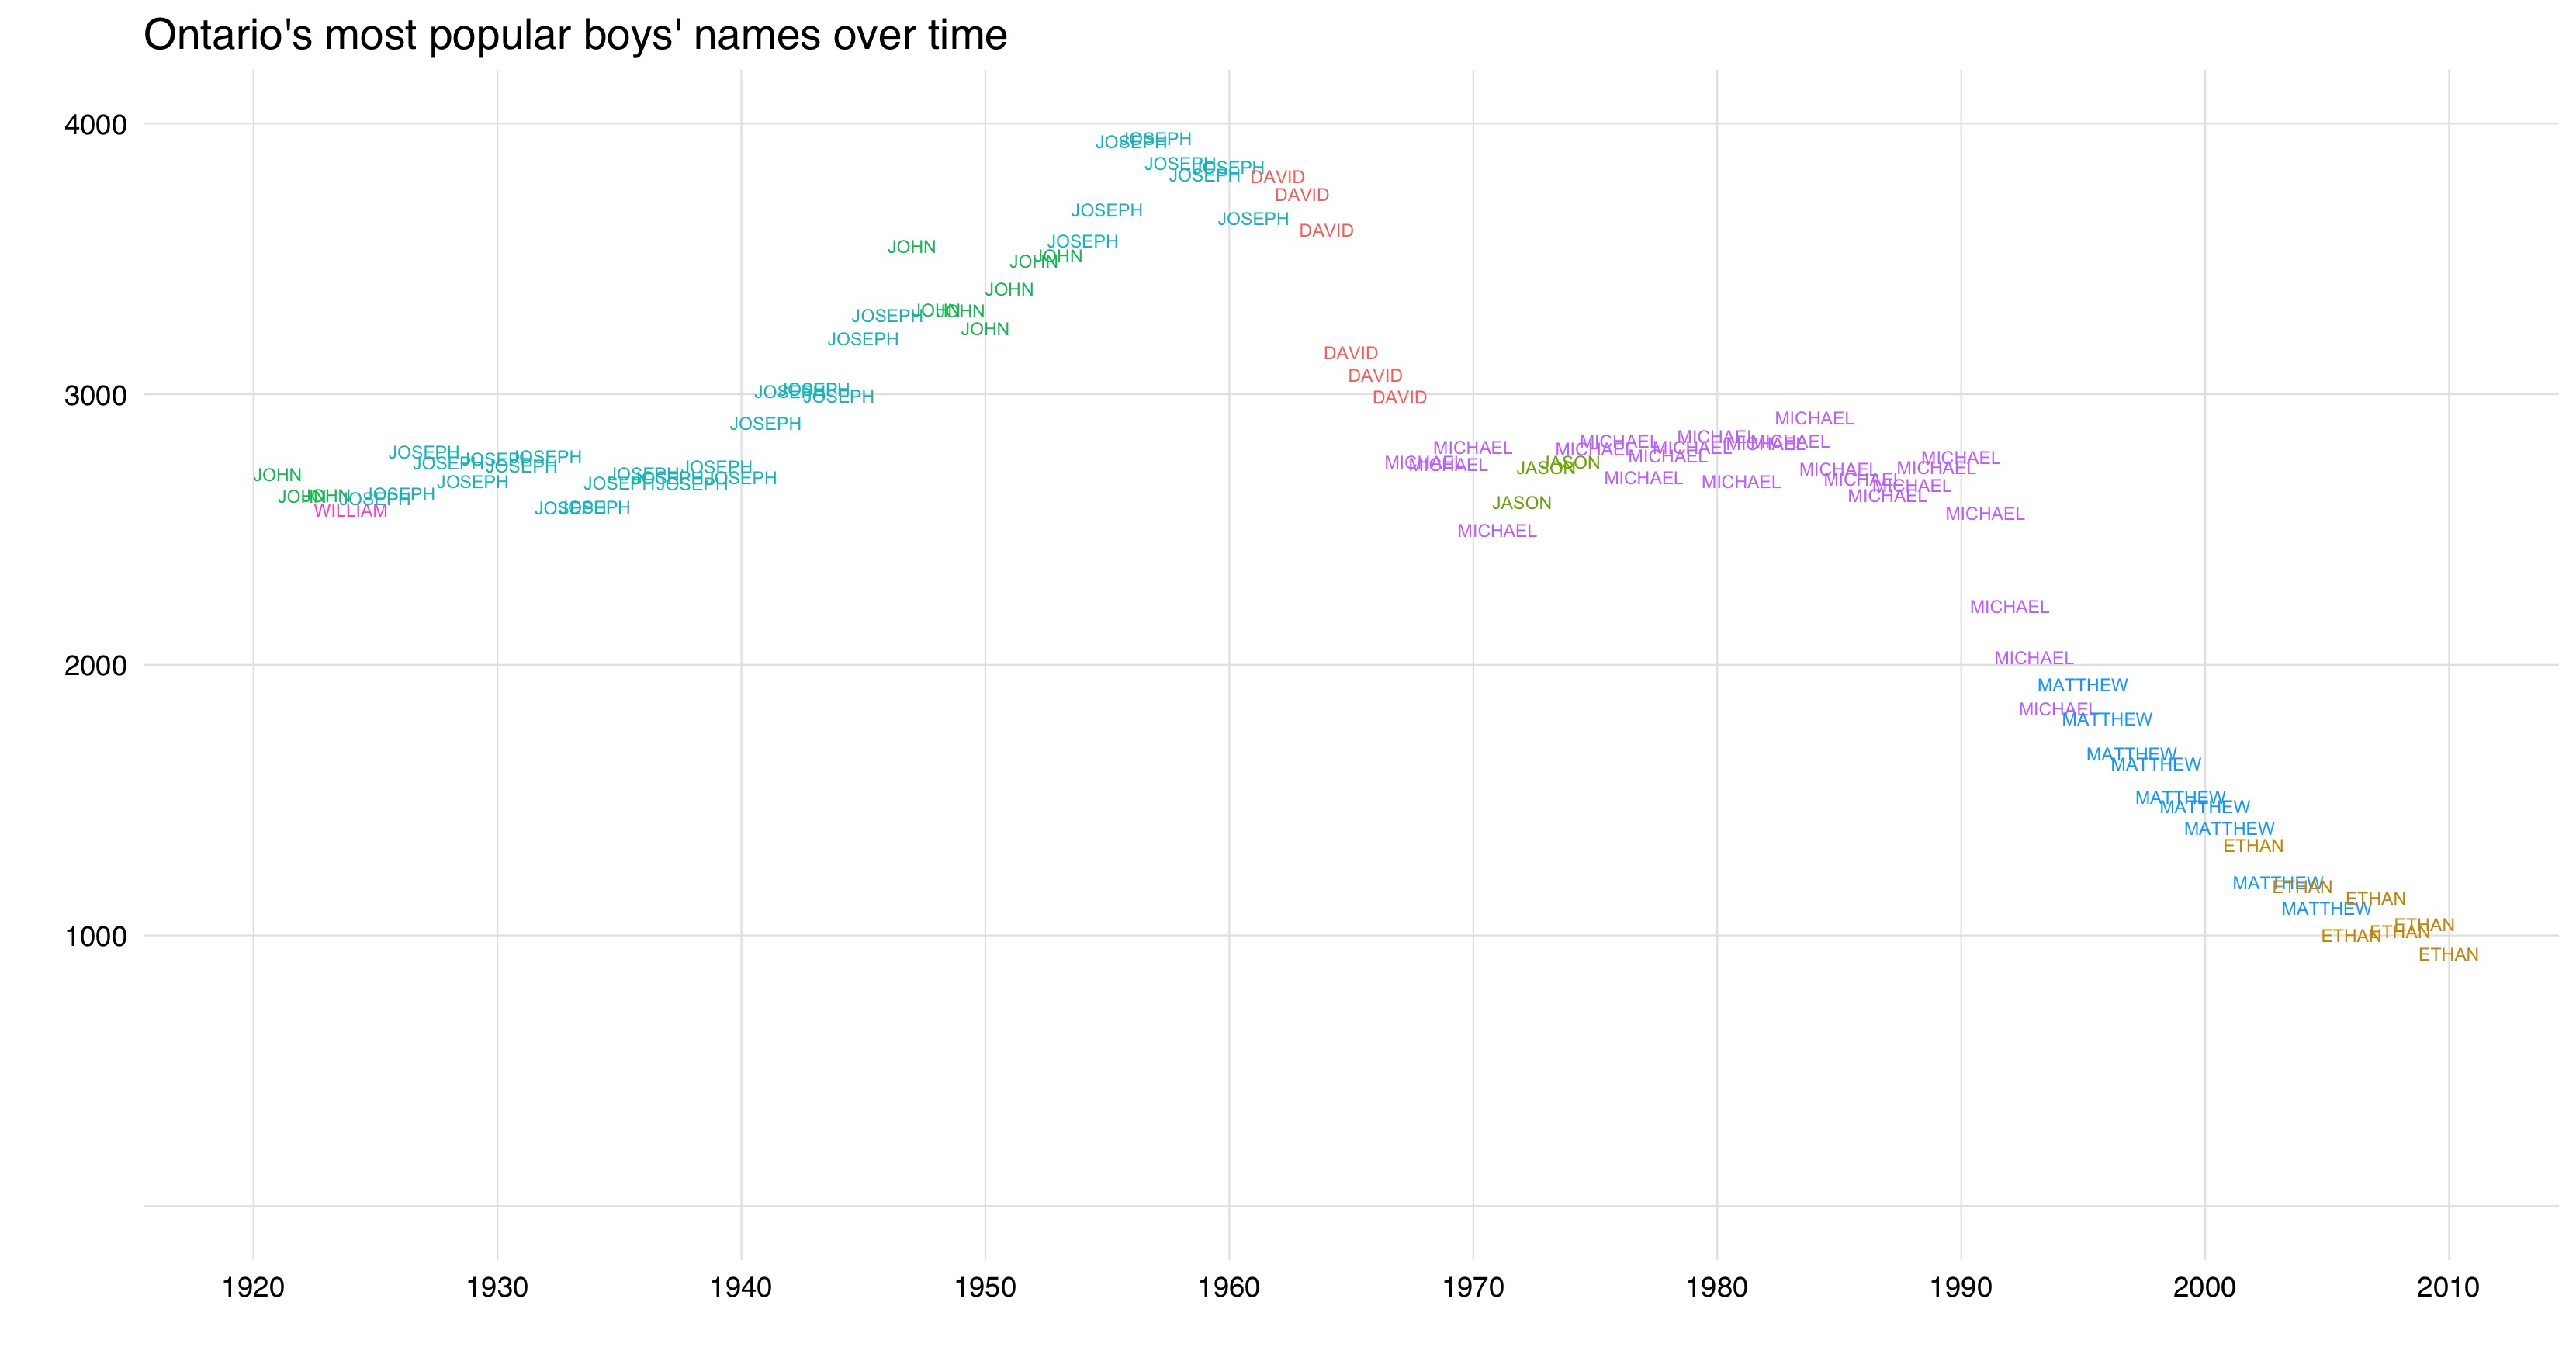
One interesting way to see the impact of this is to visualize the most popular boys’ and girls’ names in each year. As time goes on, the most popular name is given to a smaller and smaller share of children:
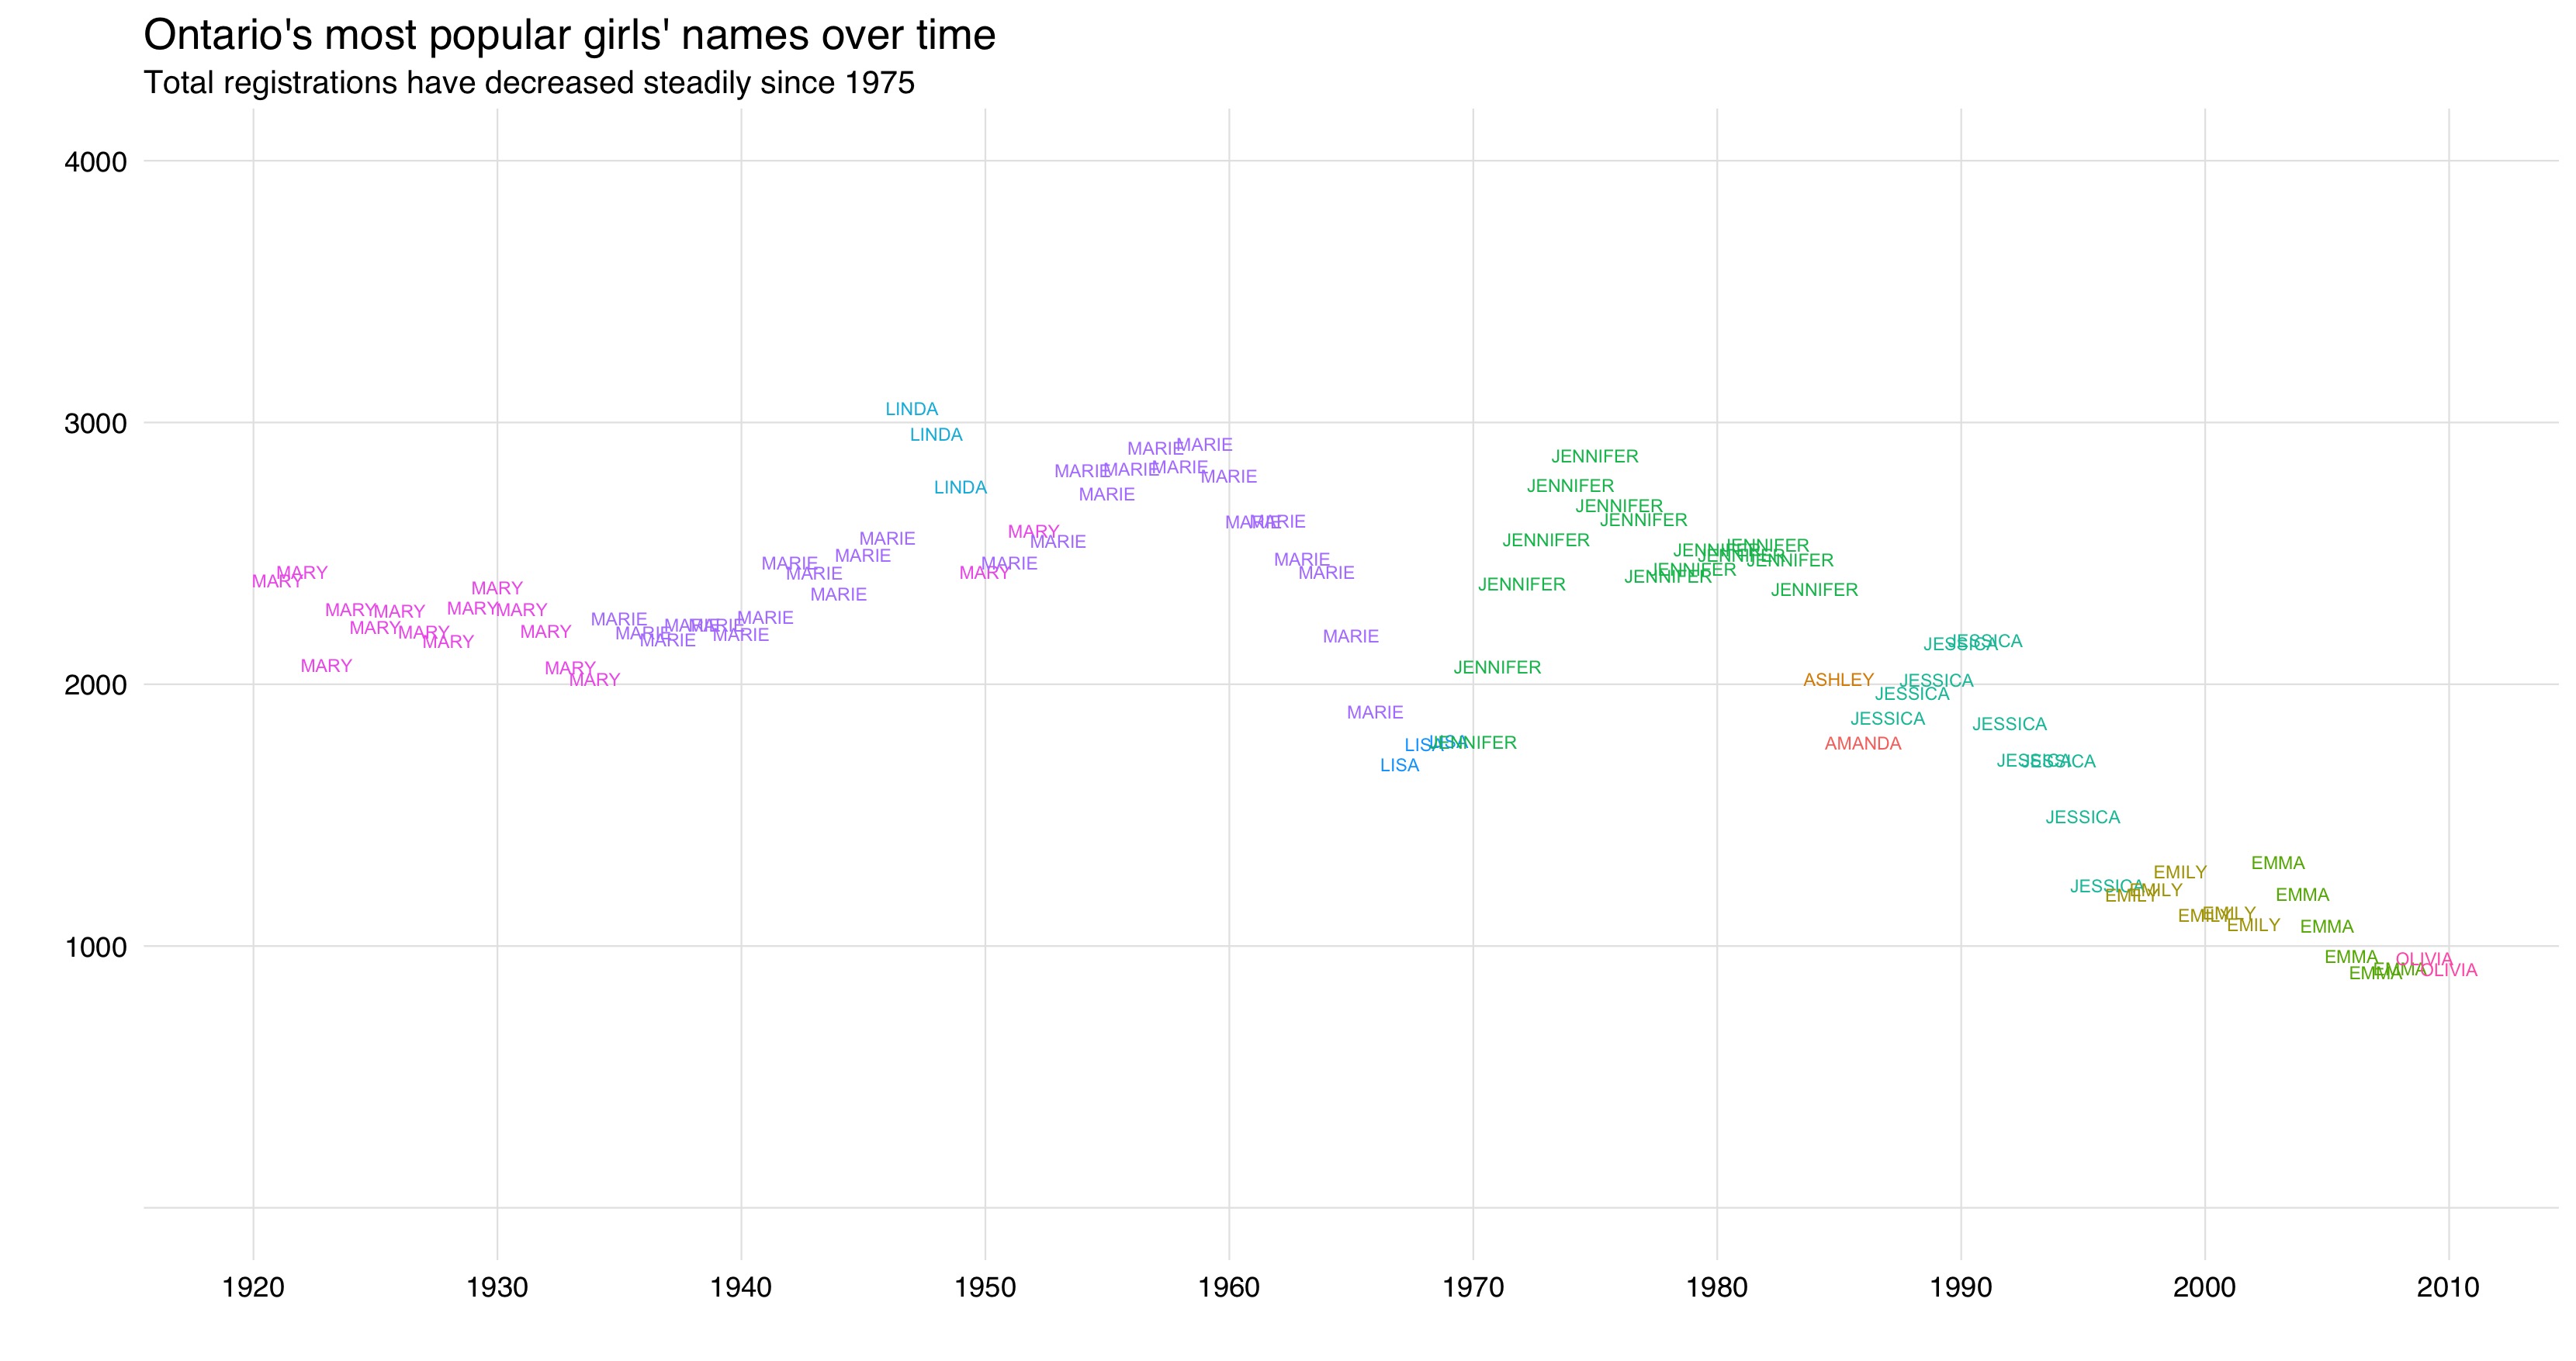
In the late 40s, Linda was given to over 3,000 newborn girls; the most popular name in 2010, Olivia, was given to fewer than 1,000. Aside from the trend toward smaller frequencies, Mary and Marie dominate the first half of the century. Ashley and Amanda are one-hit wonders in the 80s. Emma tops the charts for a fair number of years in the aughts.